


What does the company do?
Why Some Investors Are Bullish
What Bears Are Worried About
Why the Quants like this stock
My View
Quick Links
What does the company do?
Hewlett Packard Enterprise (HPE) develops IT solutions for businesses and public-sector organizations worldwide. Its businesses include servers, hybrid cloud, networking, and financial services, offering hardware, software, cloud platforms, networking and security solutions, IT financing, and flexible technology-consumption services. HPE sells through resellers, distributors, technology partners, and systems integrators. Founded in 1939, the company is headquartered in Spring, Texas.
Why Some Investors Are Bullish
Record Q3 Revenue and Earnings
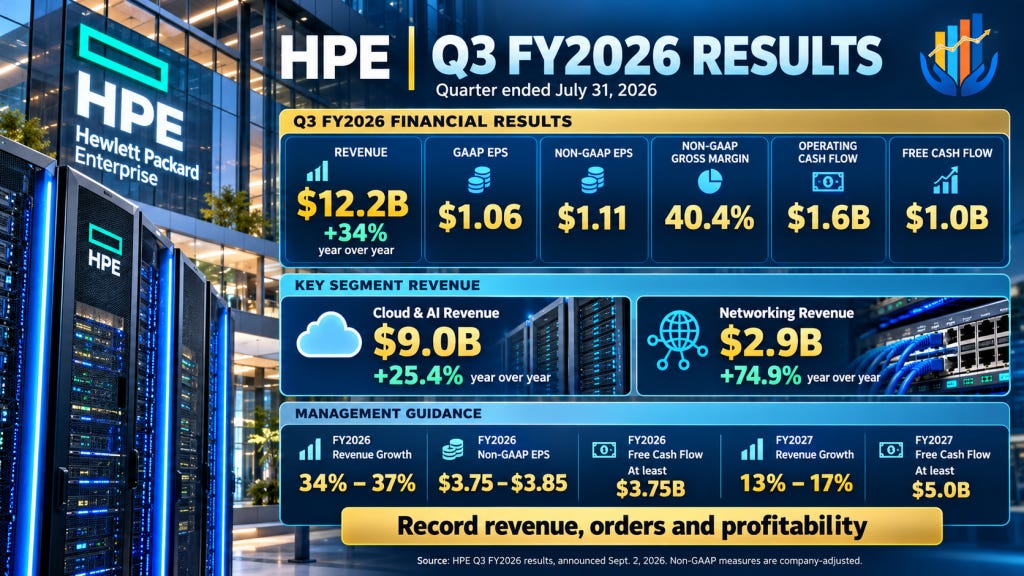
Revenue reached a record $12.21 billion, up 34% year over year.
Non-GAAP diluted EPS was $1.11, compared with approximately $0.93 expected.
Non-GAAP gross margin reached a record 40.4%, while non-GAAP operating profit rose 155% to $2.0 billion.
The results reflected strong demand across servers, networking, and AI infrastructure.
Record Orders and Backlog
Orders increased 42% year over year on a normalized basis, outpacing revenue growth.
Networking orders rose 36%, approximately 3.5 times faster than segment revenue.
HPE ended the quarter with a record order backlog, providing visibility into future sales, although supply constraints could delay conversion into revenue.
AI Infrastructure and Networking Provide Growth Opportunities
Cloud and AI revenue increased 25% to $9.0 billion.
Networking revenue reached $2.9 billion, up approximately 75% year over year, reflecting the expanded business following the Juniper Networks acquisition.
Networking orders associated with AI infrastructure reached a quarterly record of $700 million.
These trends position HPE to benefit from continued investment in AI data centers, enterprise infrastructure, and networking.
Management Raised Its Fiscal 2026 and 2027 Outlook
For fiscal 2026, HPE now expects:
Revenue growth of 34%–37%.
Non-GAAP diluted EPS of $3.75–$3.85.
Free cash flow of at least $3.75 billion.
For fiscal 2027, management expects:
Revenue growth of 13%–17%.
Non-GAAP diluted EPS of $4.40–$4.60.
Free cash flow of at least $5.0 billion.
Strong Cash Generation and Planned Shareholder Returns
Operating cash flow was approximately $1.6 billion in Q3, while free cash flow reached about $1.0 billion.
HPE returned $324 million to shareholders through dividends and share repurchases during the quarter.
Management plans to return at least 75% of Q4 free cash flow to shareholders, supporting its capital-return strategy.
What Bears Are Worried About
Supply Constraints Could Delay Growth
Demand is outpacing supply, with memory identified as the main bottleneck, followed by NAND, CPUs, and drives.
Inventory reached approximately $11.82 billion at the end of July, up from $7.16 billion a year earlier, reflecting higher component costs and purchases to support rising orders.
If component shortages persist, HPE may struggle to convert its substantial backlog into revenue as quickly as investors expect.
Record Margins May Not Be Sustainable
Although non-GAAP gross margin reached a record 40.4%, management expects margins to moderate toward more historical levels.
A higher mix of AI systems, elevated component costs, and pricing pressures could weigh on profitability.
Investors should distinguish the record Q3 margin from the level HPE can sustain as its product mix changes.
Valuation and Expectations Have Come Under Pressure
HPE shares initially fell despite the strong September earnings report, then experienced a much sharper selloff in October.
During the week ended October 16, shares dropped more than 23%, reflecting broader technology-sector weakness and concerns about the sustainability of AI-related hardware growth.
Barclays downgraded HPE to Equal Weight on October 14 and lowered its price target from $83 to $77, citing valuation concerns and questions about whether enterprise AI demand is translating into sufficient incremental revenue.
The recent decline underscores the risk that expectations can fall even when a company’s reported results are strong.
Why the Quants like this stock
P/E Non-GAAP (FWD) B+ 14.41
PEG Non-GAAP (FWD) A 0.51
Revenue Growth (FWD) B+ 21.99%
EPS FWD Long Term Growth (3-5Y CAGR) B 28.44%
ROE Growth (FWD) A- 24.88%
3M Price Performance A 22.16%
FY1 Up Revisions (last 90 days) 19 Up and 0 DownLatest Quarter’s Earnings
Announce Date 9/2/2026
EPS GAAP Actual $1.06 (Beat by $0.41)
EPS Normalized Actual $1.11 (Beat by $0.17)
Revenue Actual $12.21B
Revenue Surprise Beat by $218.91M
For a look at the live scorecard for Position Trader, see the google doc link below.
It has the Live performance numbers and some links back to more information about the five Quant stock Model Portfolio's.
.
Live Scorecard
https://live-scorecard.position-trader.com/
.
Other outside links:
Model Portfolio Quant Alpha's II Criteria
https://positiontrader.blog/four-model-portfolios/#weekly
Model Portfolio Quant Alpha's II Stock member details
https://docs.google.com/spreadsheets/d/e/2PACX-1vTD3vkFcc-exBeoQkojTMTB6nRf3hXd368LBQ4hEBuRsSW6SnYSyjM4Qg4_y5tHaeTwNzVCu0VE3psW/pubhtml?gid=0&single=true
.
Model Portfolio Quant 30 Criteria
https://positiontrader.blog/four-model-portfolios/#30
Model Portfolio Quant 30 Stock member details
https://docs.google.com/spreadsheets/d/e/2PACX-1vTD3vkFcc-exBeoQkojTMTB6nRf3hXd368LBQ4hEBuRsSW6SnYSyjM4Qg4_y5tHaeTwNzVCu0VE3psW/pubhtml?gid=153868926&single=true
.
Model Portfolio Quant Dividend and Growth 25 Criteria
https://positiontrader.blog/four-model-portfolios/#dividend
.
Model Portfolio Quant Top Stocks Criteria
https://positiontrader.blog/four-model-portfolios/#top
Model Portfolio Quant Top Stocks Stock member details
https://docs.google.com/spreadsheets/d/e/2PACX-1vTD3vkFcc-exBeoQkojTMTB6nRf3hXd368LBQ4hEBuRsSW6SnYSyjM4Qg4_y5tHaeTwNzVCu0VE3psW/pubhtml?gid=318596467&single=true
.
Model Portfolio Quant Alpha's - Legacy Criteria
https://positiontrader.blog/four-model-portfolios/#legacy
Model Portfolio Quant Alpha's - Legacy - Stock member details
https://docs.google.com/spreadsheets/d/e/2PACX-1vTD3vkFcc-exBeoQkojTMTB6nRf3hXd368LBQ4hEBuRsSW6SnYSyjM4Qg4_y5tHaeTwNzVCu0VE3psW/pubhtml?gid=54223437&single=true
.
PositionTrader.Blog - Blog Post overview
https://docs.google.com/document/d/1P2W1994O6SXvb4qfx2fqCFXnJSbPH3KJWQvqrGNqmCw/edit?tab=t.0