Education –How do USA Defense Stocks Perform During and After Major Conflicts?
USA Stock market last week 03/20/26
Major Index Performance (Weekly)
S&P 500:-2.1% for the week, marking a fourth consecutive weekly decline.
Dow Jones Industrial Average:-2.3% for the week as industrial and cyclical stocks weakened.
Nasdaq Composite:-2.1% for the week, underperforming due to continued pressure on technology stocks.
Russell 2000:-1.6% for the week, with small-caps hit hard and entering correction territory.
Takeaways
Broad market declines across all major indexes
Energy stocks outperforming sharply
Technology and small-cap sectors leading losses
Geopolitical and inflation pressures dominating market direction
Market Drivers This Week (03/23/26 – 03/27/26)
Tue, Mar 24 – Richmond Fed Manufacturing Index
This regional manufacturing gauge provided an early read on U.S. industrial activity and business sentiment following recent geopolitical disruptions.
Tue, Mar 24 – Productivity & Unit Labor Cost Revisions
Updated labor-cost data helped investors reassess inflation pressure from wages, a key variable for Federal Reserve policy.
Wed, Mar 25 – Import & Export Price Index Data
Trade price data offered insight into external inflation pressures and supply-chain cost trends affecting multinational companies.
Wed, Mar 25 – 5-Year Treasury Note Auction
Strong or weak demand for mid-duration Treasuries influenced the direction of yields and rate-sensitive sectors like technology and real estate.
Thu, Mar 26 – 7-Year Treasury Note Auction
A key event for the bond market; poor demand historically leads to yield spikes that can pressure equity valuations, especially growth stocks.
Fri, Mar 27 – Final Q4 GDP Revision Released
The government’s final estimate of fourth-quarter GDP gave investors a clearer picture of the economy’s underlying strength entering 2026.
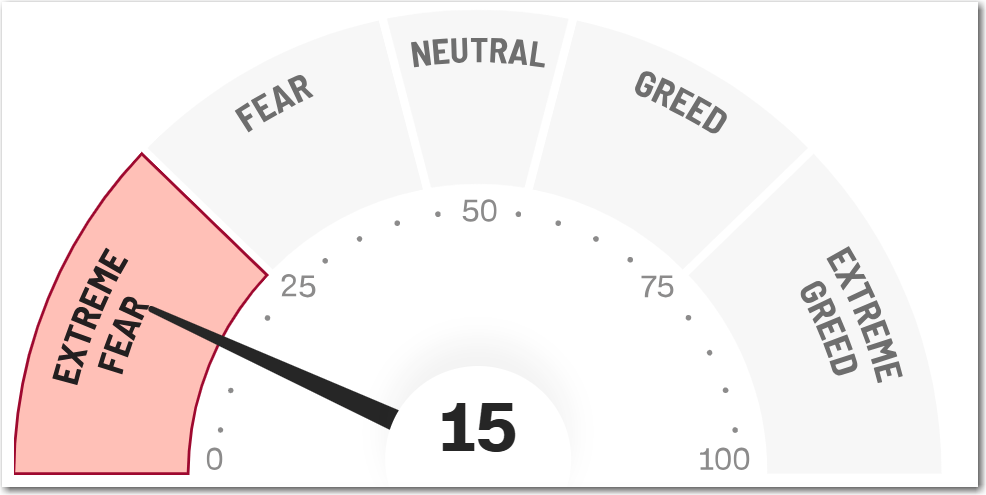
The CNN Fear and Greed Index ends the week at Extreme Fear 15. This makes two straight weeks at the Extreme Fear reading.
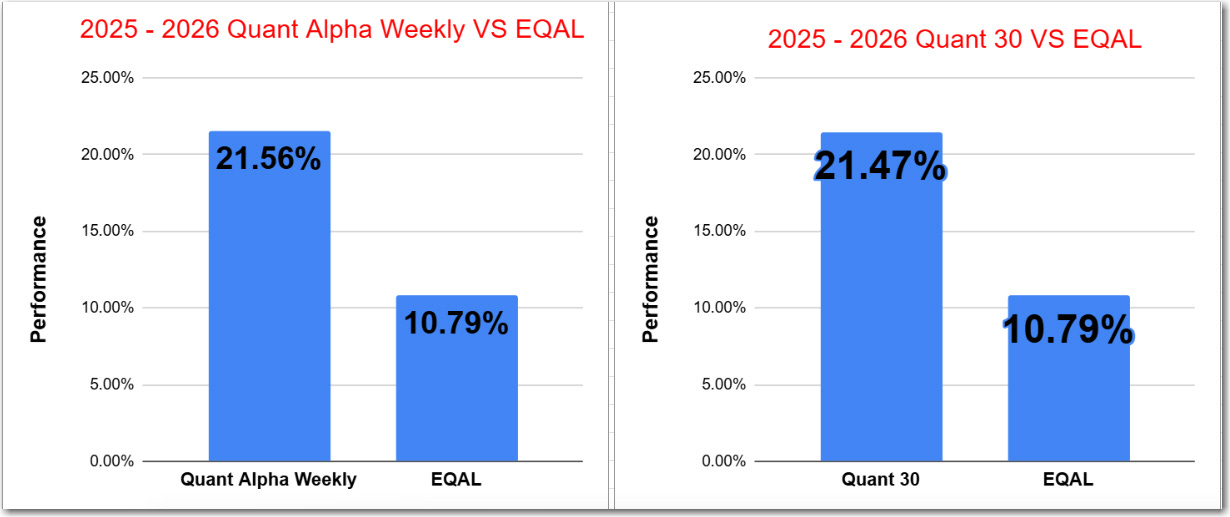
The Quant 30 and Quant Weekly Model Portfolios dropped a bit more following the general trend of the market.
Note: Choose between free and paid subscription levels. Paid subscribers enjoy instant access to weekly Portfolio updates upon release. Free subscribers access Portfolio updates after a three-week delay.
Model Portfolio Quant Alpha Weekly
Any newly added stock is being released to Paid Subscribers today. Below are the updates from three weeks ago. This Portfolio continues to significantly outperform its benchmark, 21% versus 10%.
No Adds to the Portfolio this week
Add (02/27/26) : None
Outperformers: SSRM (SSR Mining) up over 40%, MU (Micron Technology)up over 160%, VISN (Vistance Networks) up over +120%
Model Portfolio Quant 30
This week’s new update, if any, is being released to the paid subscribers. Shown below is the update made three weeks ago. This Portfolio continues to beat its benchmark by a wide margin, 21% to 10%.
One Add to the Portfolio this week
Add (02/27/26): TAYD (Taylor Devices)
Remove (02/27/26): CCL (Carnival Cruise)
Outperformers: MU (Micron Technology) up over 240%, GFI (Gold Fields) up over 60%, LITE (Lumentum Holdings) up over 190% and KGC (Kinross Gold) is up over 60%.
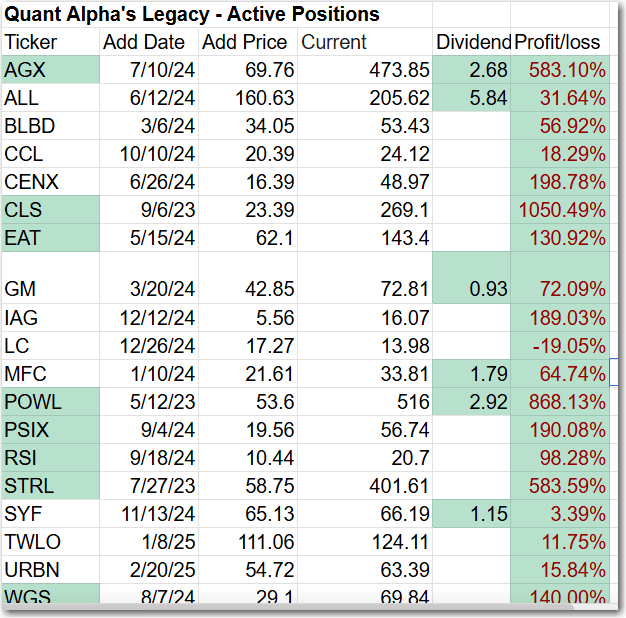
Model Portfolio Quant Alpha’s – Legacy
The portfolio now has around 19 stocks in it. It is up over +270% since it began in 2023. Celestica in now a 10 bagger.
Remove (02/27/26): None
Outperformers: AGX (Argan) up over 500%, STRL (Sterling Infrastructure) up over 500%, POWL (Powell Industries) up over 800% and CLS (Celestica) is up over 1000%
Performance to 03-20-2026
The Quant Alpha Weekly Portfolio remains ahead of its benchmark. Up over 21% since it began on June 27, 2025.
The Quant 30 Portfolio remains ahead of its benchmark. It is up 21% since it began on June 27, 2025.
The Quant Alpha’s – LegacyPortfolio maintained its over 270% return since April 2023, in a classic Position Trading Portfolio implementation.
Source: CNN.COM
How do USA Defense Stocks Perform During and After Major Conflicts?
Historical Performance by Conflict
World War II & Korean War
During World War II and the Korean War, U.S. stocks rose 17% and 19%, respectively, well above the average market return of between 8% and 10%
Gulf War (1990-1991)
When Iraq invaded Kuwait and seized its oilfields in 1990, the S&P 500 traded down by 15.9% due to oil shock concerns
The Gulf War was fought in an era of defense budget contraction, with defense spending dropping from 6.8% of GDP in 1990 to 3.8% by 2000.
Afghanistan War (2001-2021)
$10,000 invested evenly in the top five defense contractors on September 18, 2001, would have grown to $97,295 by the war’s end.
$10,000 invested in an S&P 500 index fund on the same date would be worth $61,613, meaning defense stocks outperformed the stock market overall by 58 percent during the Afghanistan War.
In less than two decades, the price of shares of the top five defense contractors increased between 3 and 12 times.
Iraq War (2003+)
Defense stocks outperformed the S&P 500 index for three years running (2000, 2001 and 2002).
From the commencement of the war on Iraq in March 2003, the S&P’s Aerospace and Defense index almost tripled in the next 4 years, easily outstripping the S&P 500’s gains.
Russia-Ukraine War (2022-Present)
In 2022, the Invesco Aerospace and Defense ETF (NYSE: PPA) index gained 8.6%, outperforming the broader U.S. market by 28% CNBC
This rise was led by Allegheny Technologies (+87%), Maxar Technologies (+75%) and Northrop Grumman (+41%) CNBC
Assets invested in the sector’s exchange-traded funds are up 268% and now total more than $11 billion.
Israel-Hamas Conflict (2023)
The October 2023 Israel–Hamas conflict had a local effect on the Israeli defense industry without contributing to the spread of geopolitical risk globally.
Key Performance Patterns
Long-Term Outperformance:
Over the past 27 years, the defense sector produced positive gains in 22 years and outperformed the U.S. stock market in 18.
As defense spending reduces or spending priority changes after wars end, defense stocks are expected to do no better than the overall market.
Bottom Line
Defense stocks historically deliver:
58-87% outperformance vs. the broader market during prolonged conflicts
Short-term spikes of 40-87% for individual companies when direct U.S. involvement is announced
Lower volatility during wartime compared to peacetime
3-12x returns over multi-decade war periods for top contractors
Mean reversion after conflicts end as defense budgets normalize
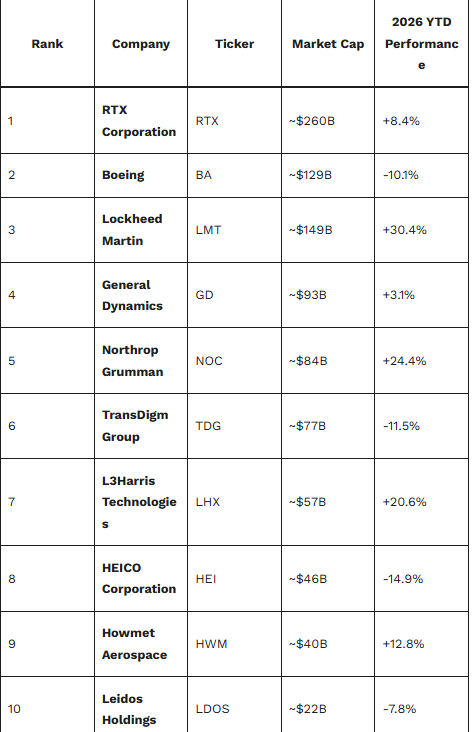
Top 10 Defense Stocks by Size and YTD Performance
All content on this site is for informational purposes only and does not constitute financial advice. Consult relevant financial professionals in your country of residence to get personalized advice before you make any trading or investing decisions. This post was written with the assistance of artificial intelligence. The original ideas and final review are human-generated.


I liked the review of the USA defense stocks and how they perform during and after wars.