

S&P500 near all time highs – Quant portfolios make all time highs – Update 04/27/26
What would be the impact to the US economy if the Strait of Hormuz was closed for three months?

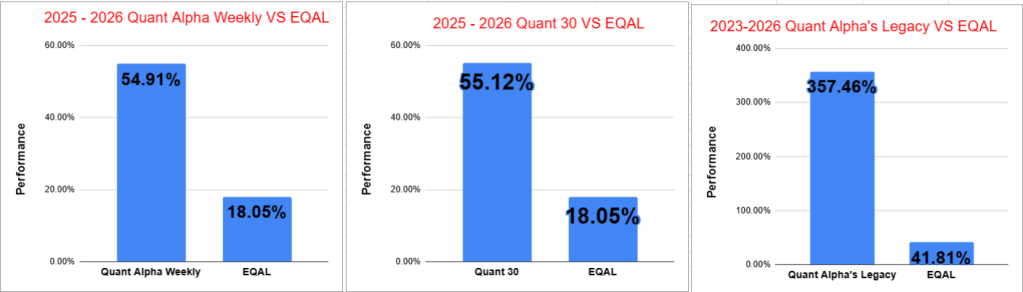
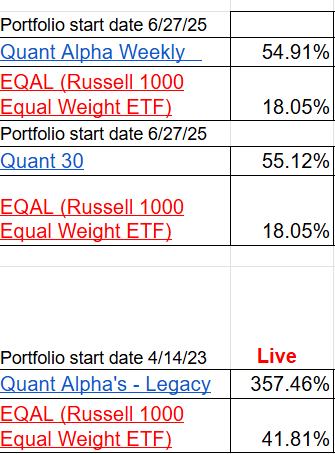
Quant Weekly – Up over 54% since June 2025
Quant 30 – Up over 55% since June 2025
Legacy – Up over 290% since April 2023
Education – What would be the impact to the US economy if the Strait of Hormuz was closed for three months?
USA Stock market week ending 04/24/26
Major Index Performance (Weekly)
SPDR S&P 500 ETF (SPY): +0.5% Modest gain over the period, holding steady with limited upside momentum.
Nasdaq Composite (^IXIC): +1.5% Led the market with the strongest relative performance and continued upside.
SPDR Dow Jones Industrial Average ETF (DIA): -0.4% The only major index to decline, showing relative weakness versus peers.
iShares Russell 2000 ETF (IWM): +0.3% Slightly positive but lagging, with minimal follow-through.
Takeaways
Nasdaq was the clear leader with the strongest gain
S&P 500 and small caps posted only modest upside
Dow lagged and finished negative, signaling relative weakness
Market Drivers this Week (04/27/26 – 05/01/26)
Monday Apr 27 — Consumer Check + Earnings Flood
Consumer confidence drops plus a stacked lineup (Coke, Visa, UPS, Starbucks, etc.)
This tells you right away if the consumer is still spending or starting to crack
Tuesday–Wednesday Apr 28–29 — Bank of Japan Wildcard
BOJ decision could shake the yen and mess with global markets
If they move, it can ripple straight into U.S. stocks — we’ve seen that movie before
Wednesday Apr 29 — Fed Decision (Main Event)
Market expects a hold, but Powell’s words are everything
No dot plot, so traders will dissect every sentence for rate-cut clues
Wednesday Apr 29 — Mega-Cap Earnings Explosion
Microsoft, Apple, Amazon, Meta all report same night as the Fed
Biggest question: is all that AI spending actually making money yet?
Wednesday Apr 29 — Economic Data Dump
Durable goods + housing data hit before the Fed
Quick read on whether the economy is holding up or slowing
Thursday Apr 30 — GDP (Biggest Risk of the Week)
First look at Q1 growth — this can move the whole market fast
Weak number = stagflation fears come right back
Thursday Apr 30 — Inflation + Wages Combo
PCE + Employment Cost Index drop right after the Fed
If inflation runs hot, kiss those rate-cut hopes goodbye
Thursday Apr 30 — Apple Earnings Spotlight
iPhone demand, China growth, and AI monetization all in focus
The CNN Fear and Greed Index ends the week at Greed 66. This is the 2nd week in row at the Greed setting. It was not too long ago that the Index was stuck in the Fear setting as the Middle East war dragged on. As it has moved up so has the market.
The Quant 30, Quant Weekly and Quant Legacy Model Portfolios all made new highs again. The Quant 30 went from up 25% at the end of March to up 55% now. The Quant Weekly went from up 27% at the end of March to up 54% now. The Quant Legacy went from up 290% at the end of March to up 353% now. Momentum stocks have come roaring back and our three Portfolios, being filled with high quantity Momentum stocks, are leading the way up.

Note: You are enjoying the free subscriber newsletter. Paid subscribers enjoy instant access to weekly Model Portfolio updates upon release and a Top Quant Stocks list. Free subscribers get access to Portfolio updates after a three-week delay but no Top Quant Stocks list. Want timely access to the new Adds/Removes and Top Quant Stocks list?
Model Portfolio Quant Alpha Weekly
Any newly added stock is being released to Paid Subscribers today. Below are the updates from three weeks ago. This Portfolio continues to significantly outperform its benchmark, 54% versus 18%. It has 23 members.
Top five Quant stocks in the Portfolio (Paid subscribers only).
No change to the Portfolio this week
Add (04/03/26) : None
Remove (04/03/26) : None
Outperformers: SSRM (SSR Mining) up over 80%, MU (Micron Technology) up over 210%, VISN (Vistance Networks) up over +140%
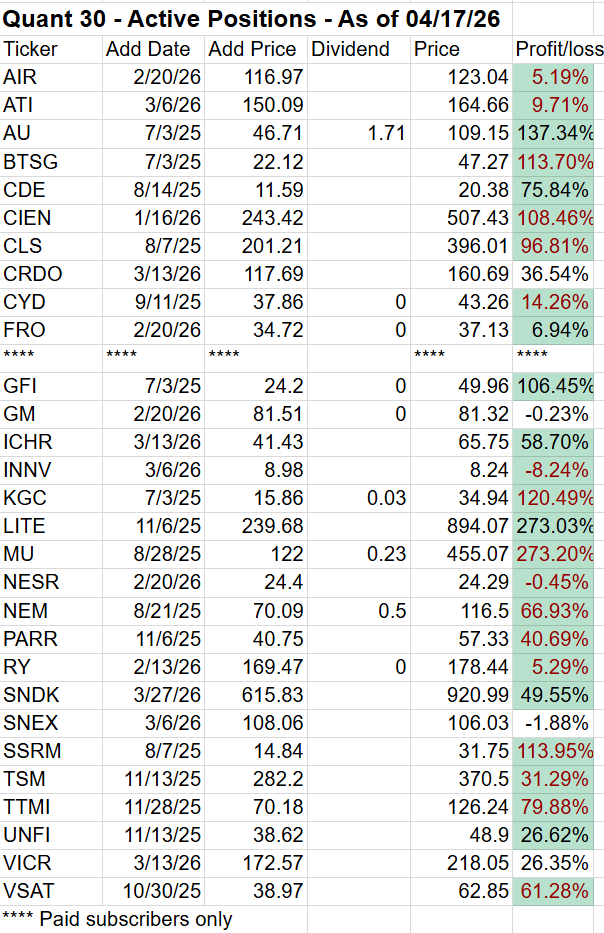
Model Portfolio Quant 30
This week’s new update, if any, is being released to the paid subscribers. Shown below is the update made three weeks ago. This Portfolio continues to beat its benchmark by a wide margin, 55% to 18%. It has 30 members in it.
Top five Quant stocks in the Portfolio (Paid subscribers only).
No changes to the Portfolio this week
Add (04/03/26): None
Remove (04/03/26): None
Outperformers: MU (Micron Technology) up over 300%, GFI (Gold Fields) up over 80%, LITE (Lumentum Holdings) up over 260% and KGC (Kinross Gold) is up over 100%.
Model Portfolio Quant Alpha’s – Legacy
The portfolio is up over +290% since it began in 2023. It has around 18 stocks in it. Powell industries is now a 13 bagger. Celestica is now a 16 bagger.
Top five Quant stocks in the Portfolio (Paid subscribers only).
Remove (04/03/26): None
Outperformers: AGX (Argan) up over 800%, STRL (Sterling Infrastructure) up over 700%, POWL (Powell Industries) up over 1300% and CLS (Celestica) is up over 1600%

Performance to 04-24-2026

Up to 10 stocks each week from different areas of the market. Paid subscribers only.

What would be the impact to the US economy if the Strait of Hormuz was closed for three months?
Energy & Oil Markets
Severe supply shock: ~20% of global oil flows disrupted for an extended period → sustained global shortage
Oil prices spike and stay elevated: Crude could surge well above $120–$150/barrel and remain volatile
U.S. fuel prices jump sharply: Gasoline and diesel rise significantly nationwide, not just short-term spikes
Strategic reserves likely tapped: U.S. may release oil from the Strategic Petroleum Reserve, but only partially offsets disruption
Energy sector windfall: U.S. oil & gas producers see massive earnings upside and increased drilling activity
Inflation Impact
Persistent inflation surge: Energy-driven inflation spreads into food, transportation, and goods
CPI re-accelerates meaningfully: Could push inflation several percentage points higher during the period
Second-order effects: Higher shipping and production costs ripple across the economy
Consumer expectations rise: Inflation psychology worsens, making price pressures more entrenched
Stock Market Reaction
Initial sharp selloff: Broad indexes (S&P 500, Nasdaq) likely drop significantly on shock and uncertainty
Sector divergence:
Energy stocks rally hard
Airlines, transport, and consumer discretionary sell off
Volatility spikes: Sustained uncertainty keeps VIX elevated for months
Potential bear market risk: If prolonged, could push equities into a deeper correction or recession pricing
Broader Economic Growth
Growth slows materially: Higher energy costs act like a tax on businesses and consumers
Consumer spending weakens: Households cut back due to rising fuel and living costs
Industrial activity pressured: Higher input costs reduce margins and output
Recession risk rises sharply: A 3-month disruption significantly increases odds of an economic downturn
Geopolitical & Military Risk Premium
Heightened global tensions: Increased risk of military escalation in the Middle East
Shipping and insurance costs surge: Global trade becomes more expensive and less efficient
Stronger dollar (initially): Safe-haven flows into USD and Treasuries
Defense sector benefits: Increased military spending expectations boost defense stocks
Bottom Line
Three months is a game-changer—not a blip
Transforms a temporary shock into a systemic global energy crisis
U.S. faces a mix of higher inflation + slower growth (stagflation risk)
Markets likely remain volatile with downside bias, while energy dominates as the clear winner

All content on this site is for informational purposes only and does not constitute financial advice. Consult relevant financial professionals in your country of residence to get personalized advice before you make any trading or investing decisions. This post was written with the assistance of artificial intelligence. The original ideas and final review are human-generated.
For a look at the live scorecard for Position Trader, see the google doc link below.
It has the Live performance numbers and some links back to more information about the three Quant stock Model Portfolio's.
https://live-scorecard.position-trader.com/
PositionTrader.Blog - Blog Post overview
https://docs.google.com/document/d/1P2W1994O6SXvb4qfx2fqCFXnJSbPH3KJWQvqrGNqmCw/edit?tab=t.0
PositionTrader.Blog - Investment Education Posts
https://positiontrader.blog/investment-education-blog-posts/
Commodities sit at rank 2 with 43.3% overweight and a rising trend, but the tension lies in what ING Investment Office, Asset Allocation Award winner 2026, observes: markets are still pricing in a temporary oil price spike, with futures for year-end delivery running more than 30 dollars below the current spot price.
The market is already discounting a resolution. Yet 61.5% of asset managers remain overweight equities (rank 1, declining trend), a combination that looks fragile if Q1 GDP disappoints and PCE accelerates simultaneously.
Consumer Discretionary, already at 50.0% underweight with a declining trend, would be the first casualty of a stagflation confirmation.
Does your quant model differentiate between sectors within the S&P 500, or is the momentum signal purely index-level?