


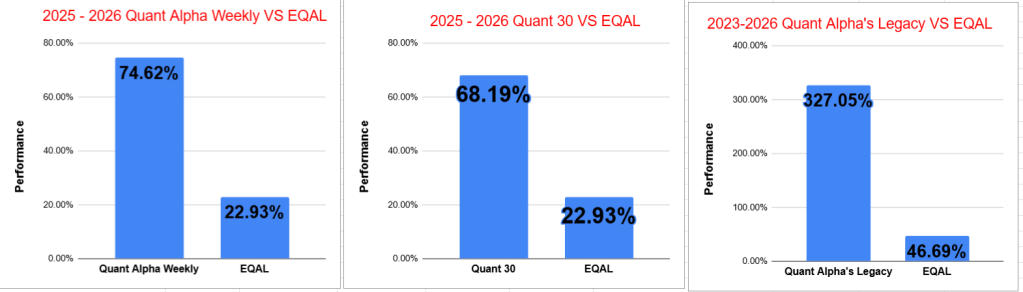
Quant Weekly – Up over 74% since June 2025
Quant 30 – Up over 68% since June 2025
Legacy – Up over 320% since April 2023
Education – Backtesting: The Reality Check Before You Risk Real Money
New Quant Dividend and Growth 25 Model Portfolio to be launched soon.
In the coming weeks a new “Quant Dividend and Growth 25” Model Portfolio will be added to the Quant lineup. It will be for Paid subscribers. More details to follow as we get closer to the launch date.
USA Stock market week ending 09/11/26
SPY: -0.8% — The S&P 500 posted a modest decline over the period.
DIA: -1.4% — The Dow Jones Industrial Average declined more than the broader market.
^IXIC: -0.7% — The Nasdaq Composite edged lower, slightly outperforming the S&P 500.
IWM: -2.2% — Small-cap stocks were the weakest performer, falling more than 2%.
SPMO: -1.0% — The S&P 500 Momentum ETF declined modestly.
Market Drivers this Week (09/14/26 – 09/18/26)
Mon., Sept. 14: Empire State Manufacturing Index and the start of the Goldman Sachs Global Retailing Conference. The Treasury also auctions $18B of 20-year notes.
Tue., Sept. 15:FOMC meeting begins; China releases August industrial production and retail sales data.
Wed., Sept. 16:Major market day: August retail sales and import/export prices are released at 8:30 a.m. ET, followed by the Fed rate decision at 2:00 p.m. and press conference at 2:30 p.m. The meeting includes updated economic projections.
Thu., Sept. 17: Philadelphia Fed manufacturing data and pending home sales provide the first major post-Fed economic readings.
Fri., Sept. 18: U.S. industrial production is released, providing the week’s final major read on manufacturing activity.
The CNN Fear and Greed Index ends the week at 33 Fear. The Index has shifted decisively from Greed toward Fear over the past month. After reaching 65 (Greed) on August 14, the index moved to 54 and 55 (Neutral) over the following two weeks before falling to 42 and ultimately 33 (Fear) on September 11.
The progression tells a clear story: investor sentiment has deteriorated rapidly. The index has fallen 32 points from its recent high of 65, moving from Greed to solid Fear in just four weeks.
9/11/26 – 33 Fear
9/4/26 – 42 Fear
8/28/26 – 54 Neutral
8/21/26 – 55 Neutral
8/14/26 – 65 Greed
8/7/26 – 64 Greed
7/31/26 – 42 Fear
7/24/26 – 39 Fear
7/17/26 – 37 Fear
7/10/26 – 49 Neutral
The Quant Model Portfolios had a modest increase this past week even thou momentum stocks as tracked by the S&P 500 Momentum ETF declined modestly. Quant Weekly stay at +74%, Quant 30 rose from +66% to +68% ande Quant Legacy rose from +322% to +327%. The market remains under stress with interest rates continuing to slowly climb and the middle east war still making headlines. Short term caution is warranted.

Note: You are reading the free subscriber newsletter. Paid subscribers enjoy instant access to weekly Model Portfolio updates upon release. Free subscribers get access to Portfolio updates after a three-week delay. Want timely access to the new Adds/Removes?
Model Portfolio Quant Alpha Weekly
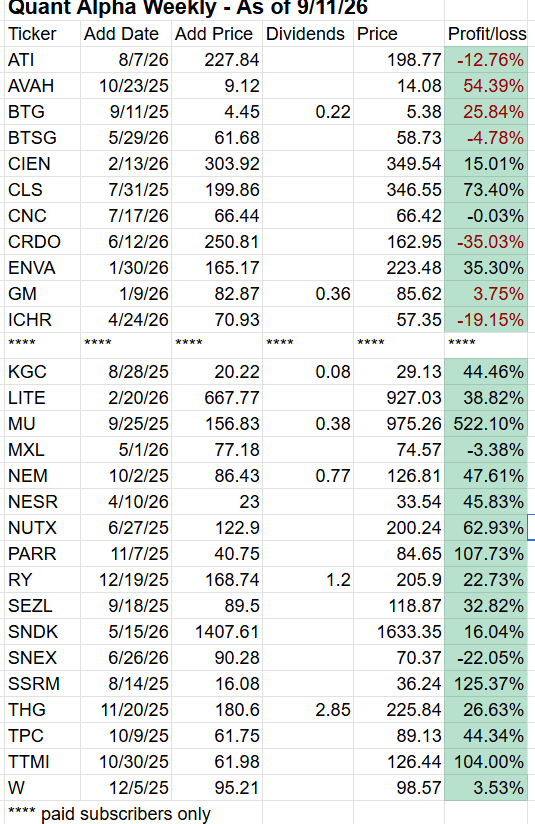
Any newly added stock is being released to Paid Subscribers today. Below are the updates from three weeks ago. This Portfolio continues to significantly outperform its benchmark, 74% versus 22%. It has 28 members.
Coeur Mining (CDE) is being removed from the Portfolio today because it has not maintained at least a Buy rating for several months. CDE was added on 9/4/25 and leaves the Portfolio +48%.
Top five Quant stocks in the Portfolio (Paid subscribers only).
Add (08/21/26) : None
Remove (08/21/26): CDE (Coeur Mining)
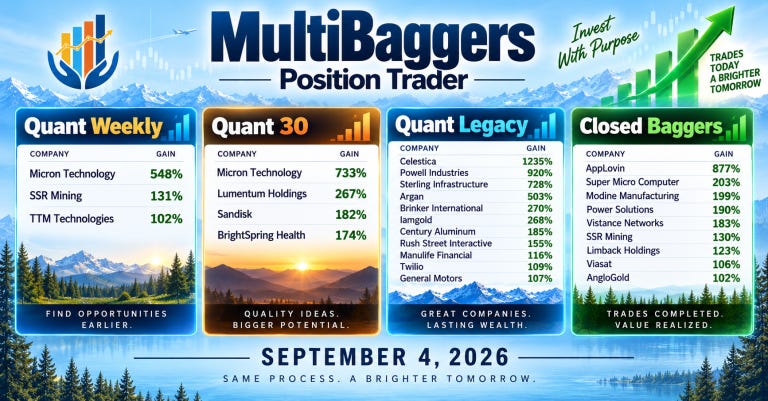
Outperformers: SSRM (SSR Mining) up over +120%, MU (Micron Technology) up over +520%, TTMI (TTM Technologies) up over +100%, PARR (Par Pacific Holdings) up over +100%
Model Portfolio Quant 30
This week’s new update, if any, is being released to the paid subscribers. Shown below is the update made three weeks ago. This Portfolio continues to beat its benchmark by a wide margin, 68% to 22%. It has 30 members in it.
AAR Corp (AIR) is being removed from the Portfolio today because it has not maintained the Strong Buy rating for a certain number of days. AIR was added on 2/20/26 and was +15% when removed.
Top five Quant stocks in the Portfolio (Paid subscribers only).
Add (08/21/26): PBF (PBF Energy) – Oil & Gas Refining & Marketing
Remove (08/21/26): AIR (AAR Corp)
Outperformers: MU (Micron Technology) up over +690%, LITE (Lumentum Holdings) up over +280%, BTSG (BrightSpring Health) up over +160% and SNDK (Sandisk) up over +160%
Model Portfolio Quant Alpha’s – Legacy
The portfolio is up over +320% since it began in 2023. It has 17 stocks in it. Powell industries is now a 9 bagger. Celestica is now a 13 bagger
Top five Quant stocks in the Portfolio (Paid subscribers only).
Remove (08/21/26): None
Outperformers: AGX (Argan) up over +400%, STRL (Sterling Infrastructure) up over +700%, POWL (Powell Industries) up over +900% and CLS (Celestica) is up over +1300%
Model Portfolio Quant Top Stock
This new Portfolio adds one new stock a week. A separate email is sent on Thursday morning detailing the selection, a shallow dive on the pros and cons of the stock and the criteria used for the Portfolio.
Add: AVAH (Aveanna Healthcare) – Medical Care Facilities

Performance to 09-11-2026
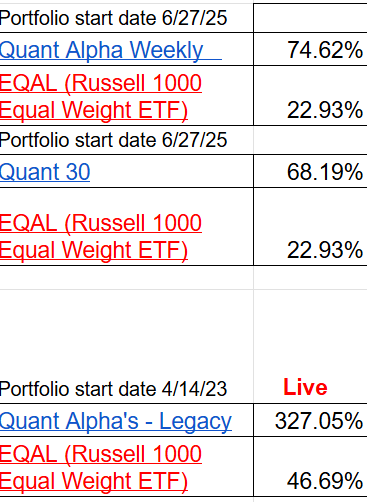
Top Quant Stocks for this week – (Paid subscribers only feature)
Paid subscribers were presented with a list of the Top 10 Dividend Stocks today.
Top Dividend Stocks were last listed on 6/26/26. Here are the results since then:
6/26/26 thru 9/11/26
Top Divided Stocks = Average +5.7% each 10 selections
VYM (Vanguard High Dividend Yield Index Fund) = +3.0%
Top Dividend Stocks were previously listed on April 10, 2026. Here are the results up to 6/26/26:
4/10/26 thru 6/26/26
Top Divided Stocks = Average +10.45% each 10 selections
VYM (Vanguard High Dividend Yield Index Fund) = +4.7%

Backtesting: The Reality Check Before You Risk Real Money
Before putting real money behind a stock-picking model or trading strategy, it helps to ask a simple question: Would this strategy have worked in the past? That is where backtesting comes in. By applying a strategy’s rules to historical market data, investors can evaluate returns, drawdowns, volatility and how the strategy behaved through different market environments. But a backtest is a research tool—not a crystal ball—and poorly designed tests can create false confidence.
What a Good Backtest Can Tell You
It tests the idea, not the story.
An investment strategy may sound logical, but backtesting forces investors to put numbers behind the thesis and see whether the rules actually produced attractive results.It shows what happens when markets get ugly.
A strategy that thrives in a bull market may struggle during recessions, crashes or rising-rate environments. Testing across different market regimes helps investors understand both the opportunity and the potential pain.It exposes the downside.
A 15% annual return sounds great until you discover the strategy once fell 50% and took years to recover. Maximum drawdown, volatility and recovery time can be just as important as total return when deciding whether you can actually stick with the strategy.It helps separate an edge from a coincidence.
One of the biggest dangers is overfitting—continually tweaking a strategy until it looks perfect in historical data. Out-of-sample testing can help determine whether the strategy has a repeatable edge or simply fits the past unusually well.It improves portfolio construction.
Backtesting can reveal whether supposedly different investments actually move together during periods of market stress. Ten stocks are not necessarily ten sources of diversification if they all fall at the same time.
The Backtesting Traps
A great-looking backtest can still be misleading. Survivorship bias can occur when a test includes only companies that still exist today, while ignoring businesses that went bankrupt, were acquired or were delisted. Look-ahead bias occurs when a test accidentally uses information that would not have been available when the investment decision was originally made. And ignoring trading costs, spreads and slippage can make simulated returns look better than what an investor could realistically achieve.
My Takeaway
I view backtesting as a reality check, not a prediction. It can challenge my assumptions, reveal hidden risks and show me how a strategy might behave before I commit real capital. The goal isn’t to find the backtest with the highest return; it’s to build a strategy that makes sense, survives realistic testing and is one I can actually follow when markets get difficult.

Quick Links
See comments.
All content on this site is for informational purposes only and does not constitute financial advice. Consult relevant financial professionals in your country of residence to get personalized advice before you make any trading or investing decisions. This post was written with the assistance of artificial intelligence. The original ideas and final review are human-generated.
I do not see many growth and income type of portfolios on substack. Looking forward to see how your new one does over time.
For a look at the live scorecard for Position Trader, see the google doc link below.
It has the Live performance numbers and some links back to more information about the three Quant stock Model Portfolio's.
https://live-scorecard.position-trader.com/
Other links:
https://positiontrader.blog/four-model-portfolios/#weekly
https://positiontrader.blog/four-model-portfolios/#30
https://positiontrader.blog/four-model-portfolios/#dividend
https://positiontrader.blog/four-model-portfolios/#legacy
https://docs.google.com/document/d/1P2W1994O6SXvb4qfx2fqCFXnJSbPH3KJWQvqrGNqmCw/edit?tab=t.0