


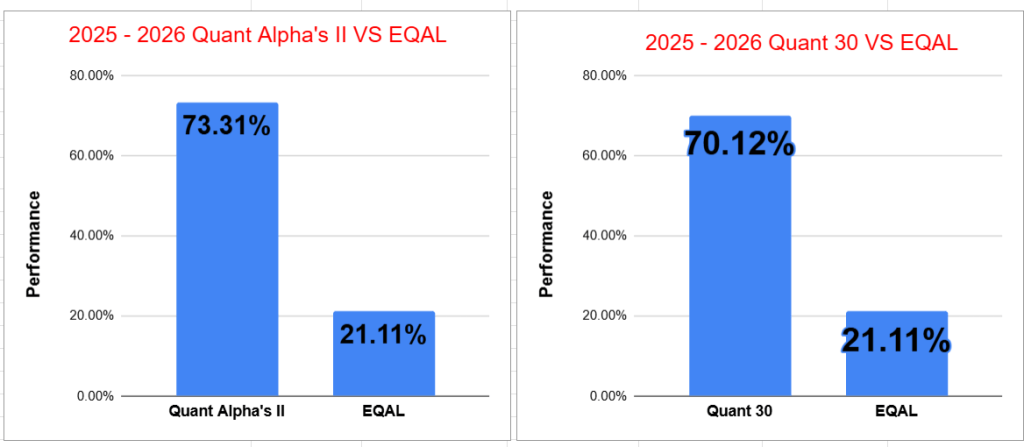
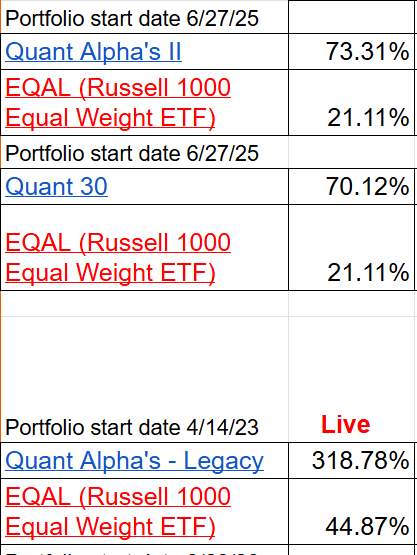
Quant Alpha’s II – Up over 73% since June 2025
Quant 30 – Up over 70% since June 2025
Legacy – Up over 310% since April 2023
Education – What Happens to Stocks After the Fed’s First Rate Hike?
New Quant Dividend and Growth 25 Model Portfolio to be launched September 28, 2026.
On September 28 a new “Quant Dividend and Growth 25” Model Portfolio will be added to the Quant lineup. It will be for Paid subscribers. This will be a Growth and Income type of portfolio. It will have 25 stocks in it and will be reviewed and updated as needed each week. Each stock in the portfolio will pay a dividend and be highly ranked in both the Quant Factors and the Quant Dividend metrics.
USA Stock market week ending 09/18/26
SPY -0.1% — The S&P 500 finished the week essentially flat, slipping 0.1%.
DIA -1.7% — The Dow posted the weakest performance among the major indexes, declining 1.7%.
^IXIC +0.7% — The Nasdaq Composite gained 0.7%, outperforming the broader market.
IWM -1.5% — The Russell 2000 fell 1.5%, reflecting weakness among small-cap stocks.
SPMO +0.6% — The Invesco S&P 500 Momentum ETF gained 0.6%, showing modest strength among momentum stocks.
Market Drivers this Week (09/21/26 – 09/25/26)
Tuesday 9/22: The Richmond Fed Manufacturing Index provides a regional read on factory activity. Fed officials are also scheduled to speak, keeping monetary policy and the rate outlook in focus.
Wednesday 9/23: September flash S&P Global PMIs for manufacturing, services and the overall economy provide an early look at economic momentum. Treasury-market activity and additional Fed commentary could also influence yields and stocks.
Thursday 9/24: Investors turn to weekly jobless claims and other economic data, while corporate earnings and Treasury-market moves remain important for market direction.
The CNN Fear & Greed Index continued to signal increasing investor caution, falling to 29 (Fear) on 9/18/26, down from 33 (Fear) on 9/11 and 42 (Fear) on 9/4. Overall, the data shows a clear shift from Greed in mid-August to Fear by mid-September, indicating a significant deterioration in market sentiment over the six-week period.
9/18/26 – 29 Fear
9/11/26 – 33 Fear
9/4/26 – 42 Fear
8/28/26 – 54 Neutral
8/21/26 – 55 Neutral
8/14/26 – 65 Greed
8/7/26 – 64 Greed
7/31/26 – 42 Fear
7/24/26 – 39 Fear
The Quant Model Portfolios had a largely flat week with Quant Alpha’s II up 73% and Quant 30 up 70% from their start date last year. Quant Alpha’s legacy is up 318% from its start date in 2023.

Note: You are reading the free subscriber newsletter. Paid subscribers enjoy instant access to weekly Model Portfolio updates upon release. Free subscribers get access to Portfolio updates after a four week or more delay. Want timely access to the new Adds/Removes?
Model Portfolio Quant Alpha’s II
The Model Portfolio Quant Alpha Weekly is now renamed to Model Portfolio Quant Alpha’s II. It still uses the same criteria as the original highly successful Model Portfolio Quant Alpha’s which was retired in early 2025. Only the name is being changed.
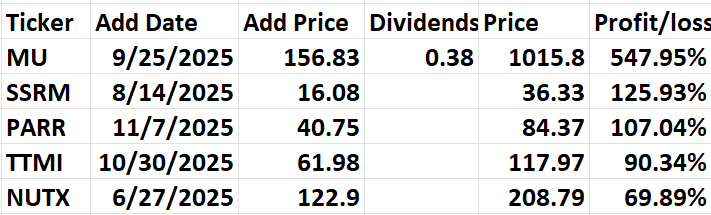
Any newly added stock is being released to Paid Subscribers today. This Portfolio continues to significantly outperform its benchmark, 73% versus 21%. It has 28 members.
Model Portfolio Quant 30
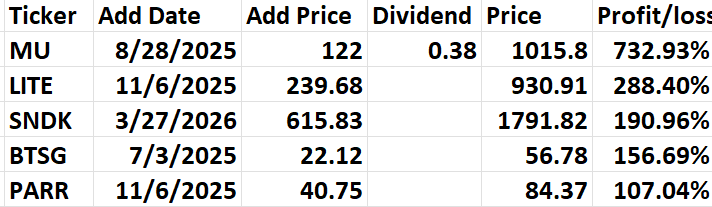
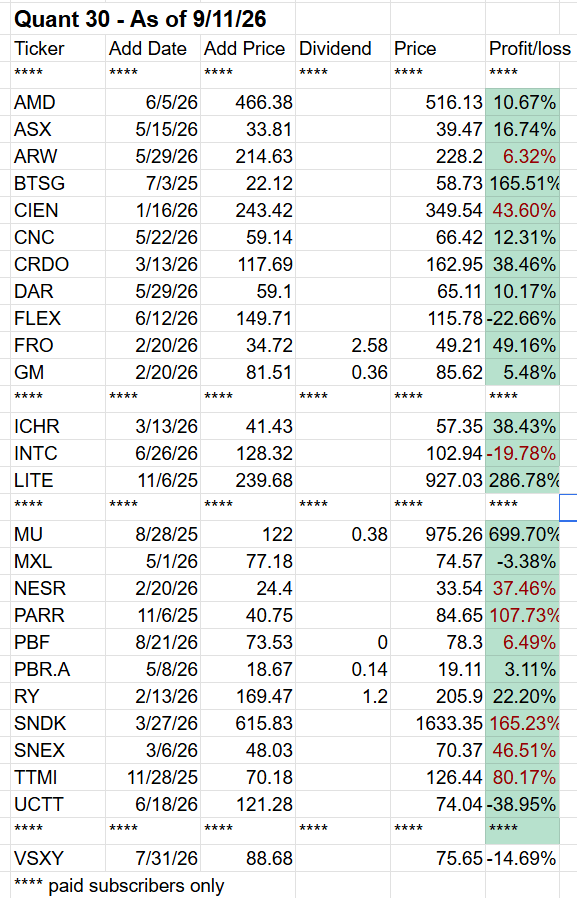
This week’s new update, if any, is being released to the paid subscribers. This Portfolio continues to beat its benchmark by a wide margin, 70% to 21%. It has 30 members in it.
Model Portfolio Dividend and Growth 25
Start date September 28 for Paid Subscribers
Model Portfolio Quant Alpha’s – Legacy
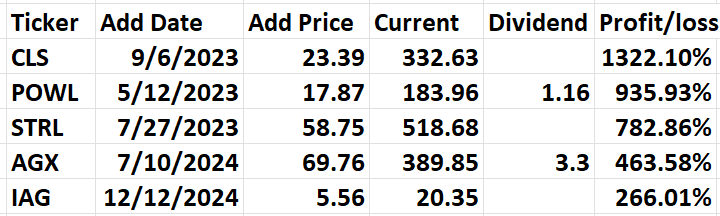
The portfolio is up over +310% since it began in 2023. It has 17 stocks in it. Powell industries is now a 9 bagger. Celestica is now a 13 bagger
Model Portfolio Quant Top Stock
This new Portfolio adds one new stock a week. A separate email is sent on Thursday morning detailing the selection, a shallow dive on the pros and cons of the stock and the criteria used for the Portfolio.
Add: HPE (Hewlett Packard Enterprise) – Communication Equipment

Performance to 09-18-2026

What Happens to Stocks After the Fed’s First Rate Hike?
A common assumption is that the Federal Reserve’s first rate increase of a tightening cycle is automatically bearish for stocks. History is more nuanced: the initial hike often produces a period of volatility and adjustment, but equities have frequently recovered over the following year—particularly when the Fed is tightening because the economy remains healthy.
The initial reaction can be mixed
Looking at the six tightening cycles since 1994, the S&P 500 has generally struggled during the first several months after the initial hike. Average returns were negative through roughly the first four months before improving around months five and six.
That doesn’t mean every cycle follows the same script. Markets can react differently depending on what investors have already priced in, how aggressive the Fed is expected to be, and whether economic growth and corporate earnings remain strong.
One year later, the picture has historically improved
Despite the early weakness, the S&P 500 has generally recovered over the subsequent 12 months. Across the six post-1994 tightening cycles, the average 12-month gain following the first hike was approximately 6.7%, while the median was 10.7%. The median is particularly useful because one unusually strong cycle—the S&P 500 gained about 42% following the March 1997 initial hike—skews the average upward.
The speed of tightening matters
One of the most important distinctions is how quickly the Fed continues raising rates.
Slow tightening cycles: Historically, markets have generally handled these better. Investors and companies have more time to adjust to higher borrowing costs.
Fast tightening cycles: Rapid increases can produce substantially deeper drawdowns, particularly when the Fed is responding to persistent inflation or when economic growth is already weakening.
The 2022 cycle provides a useful modern example: the Fed began raising rates while inflation was extremely elevated and subsequently tightened aggressively. The S&P 500 fell sharply that year, demonstrating that the economic environment surrounding the hikes matters far more than the first 25-basis-point move by itself.
Why doesn’t the market necessarily crash?
A rate hike isn’t inherently bearish. In many cases, the Fed begins tightening because economic activity, employment, consumer spending, and corporate earnings are strong enough to tolerate less accommodative monetary policy.
That’s the critical distinction: higher rates can pressure valuations, but a growing economy can simultaneously support revenues and earnings.
What about individual sectors?
The conventional assumption that technology automatically performs poorly whenever rates rise is too simplistic. Sector performance around the start of hiking cycles varies considerably, with Energy, Industrials, Materials and Consumer Discretionary showing relatively similar performance to other years, while Consumer Staples, Health Care, Financials and Utilities have historically tended to underperform the S&P 500 during years when hiking cycles began.
Financials are also more complicated than simply saying “higher rates are good for banks.” Higher rates can help lending margins in some circumstances, but an inverted yield curve, weaker loan demand, or rising credit losses can offset that benefit.
The investment takeaway
A first Fed rate hike is historically a yellow light—not necessarily a red one. Stocks often become more volatile and can experience a meaningful correction during the first several months, but history shows that equities have frequently recovered and produced positive returns over the following year.
The real danger isn’t simply higher rates. It’s rapidly rising rates combined with deteriorating economic growth, weakening earnings, and recession risk.

Quick Links
See comments.
All content on this site is for informational purposes only and does not constitute financial advice. Consult relevant financial professionals in your country of residence to get personalized advice before you make any trading or investing decisions. This post was written with the assistance of artificial intelligence. The original ideas and final review are human-generated.
For a look at the live scorecard for Position Trader, see the google doc link below.
It has the Live performance numbers and some links back to more information about the three Quant stock Model Portfolio's.
https://live-scorecard.position-trader.com/
Other links:
https://positiontrader.blog/four-model-portfolios/#weekly
https://positiontrader.blog/four-model-portfolios/#30
https://positiontrader.blog/four-model-portfolios/#dividend
https://positiontrader.blog/four-model-portfolios/#legacy
https://docs.google.com/document/d/1P2W1994O6SXvb4qfx2fqCFXnJSbPH3KJWQvqrGNqmCw/edit?tab=t.0