

Selection for this week
Some Pros about the stock
Some Cons about the stock
Why the Quants like this stock
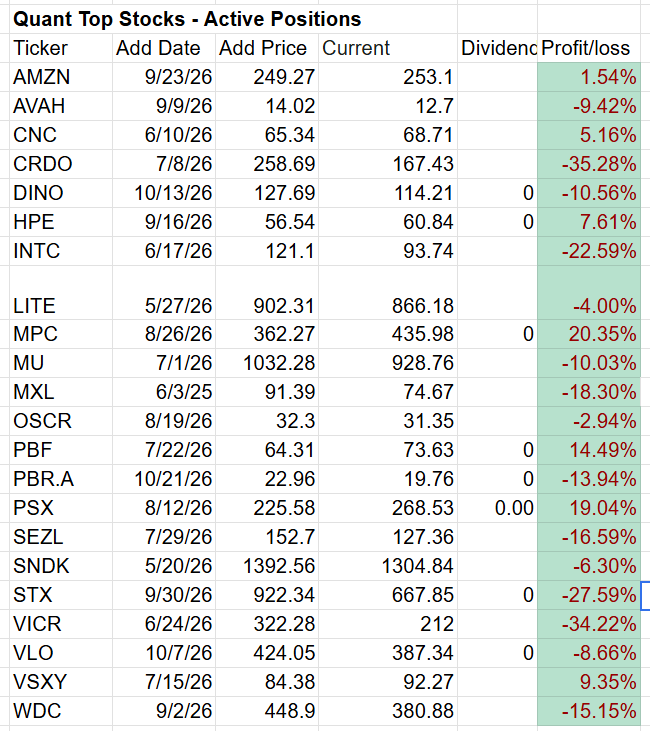
Active Positions
Quick Links
The momentum stocks in the portfolio as a group were largely unchanged since last Thursday. Risk Off is still the dominant theme in the market but the portfolio is holding its own despite that. The portfolio now has 23 stocks in it.
Add: NIQ (NIQ Global Intelligence plc)
What does the company do?
NIQ is a global consumer intelligence and market research company that collects and analyzes shopping and retail data. It helps consumer brands and retailers understand what people buy, where they shop, how purchasing behavior changes, and how their products perform against competitors. Its data, software, and AI-powered analytics support decisions involving pricing, marketing, product launches, promotions, and market share growth. NIQ operates in more than 90 countries, serving clients across a wide range of consumer goods and retail markets.
NIQ was originally founded on August 24, 1923, by Arthur C. Nielsen Sr. in Chicago, Illinois. The modern standalone NielsenIQ business was established in March 2021, when Advent International completed its acquisition of the business from Nielsen Holdings.
Current headquarters: 200 West Jackson Boulevard, Chicago, Illinois 60606, USA.
Why Some Investors Are Bullish
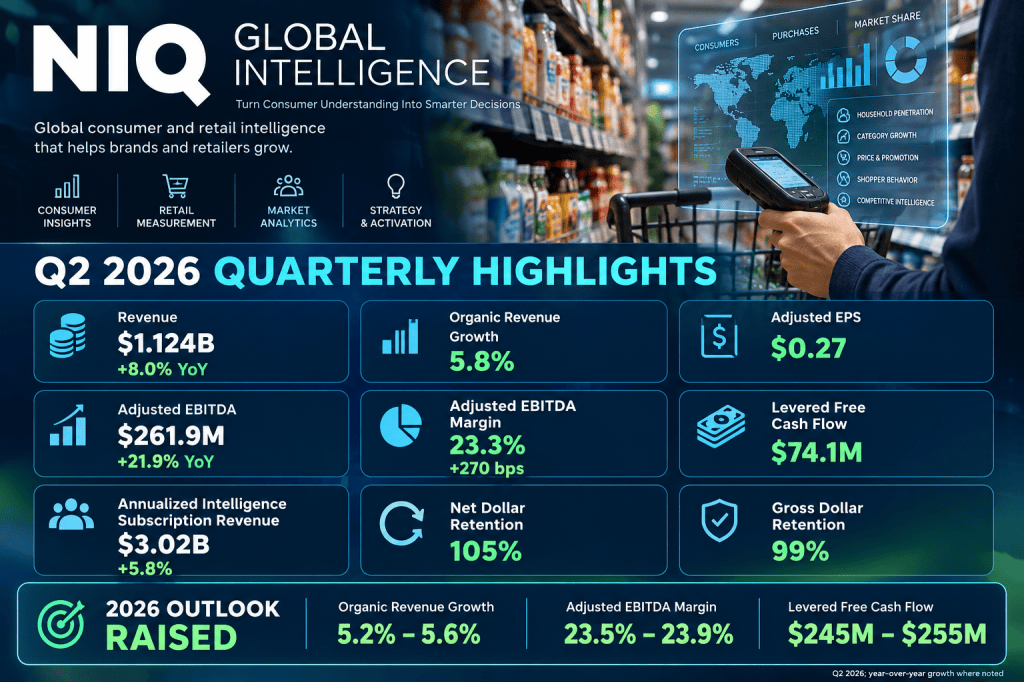
Fifth consecutive quarterly beat. NIQ delivered Q2 revenue of $1.124 billion, up 8.0% year over year, including 5.8% organic constant-currency growth. Adjusted EPS was $0.27, beating the approximately $0.21 analyst consensus, while adjusted EBITDA increased 21.9% to $261.9 million.
Raised full-year guidance. Management raised its 2026 outlook to 5.2%–5.6% organic constant-currency revenue growth, a 23.5%–23.9% adjusted EBITDA margin, adjusted EPS of $1.08–$1.12, and $245 million–$255 million in levered free cash flow. The company also targets a year-end net leverage ratio below 3.0 times.
Recurring revenue and strong customer retention. Annualized Intelligence subscription revenue reached $3.02 billion, up 5.8%. Net dollar retention was 105%, while gross dollar retention was 99%, indicating that NIQ is retaining most existing subscription revenue and generating additional business from its customer base.
AI initiatives and cost savings offer growth potential. NIQ is expanding AI-powered analytics and product offerings to help clients interpret consumer behavior and improve business decisions. Its 2026 restructuring program is designed to generate $70 million–$80 million in annualized cost savings by year-end, potentially supporting further margin improvement.
Improving cash generation and credit profile. Q2 levered free cash flow reached $74.1 million, compared with negative cash flow in the year-ago quarter. S&P Global Ratings upgraded NIQ’s credit rating from B to B+, citing improved cash generation, while management expects approximately $300 million in levered free cash flow during the second half of 2026.
What Bears Are Worried About
GAAP losses and substantial debt. NIQ reported a Q2 net loss attributable to the company of $30.5 million, despite stronger adjusted earnings. Total debt was approximately $3.49 billion at June 30, 2026, leaving the company exposed to interest costs and limiting financial flexibility if growth or cash generation weakens.
Significant share-price volatility. NIQ shares have experienced a wide trading range. After reaching a 52-week low of approximately $7.93, the stock rebounded to close at $19.91 on October 26, near its 52-week high of $20.17. Such swings can create opportunities but also increase the risk of buying after a sharp rally.
Limited valuation cushion and execution risk. One late-October analyst compilation placed the average price target near $20.69, only modestly above the stock’s October 26 closing price. NIQ must continue converting subscription growth into cash flow, realize planned cost savings, and demonstrate that its AI investments can support sustainable growth. Any disappointment could pressure a stock that has already rebounded sharply.
Why the Quants like this stock
P/E Non-GAAP (FWD) C- 18.14
Revenue Growth (YoY) B 8.86%
Gross Profit Margin (TTM) B- 55.40%
3M Price Performance A+ 78.95%
FY1 Up Revisions (last 90 days) 14 Up 0 DownLatest Quarter’s Earnings
Announce Date 8/10/2026
EPS GAAP Actual -$0.10 (Beat by $0.02)
EPS Normalized Actual $0.27 (Beat by $0.07)
Revenue Actual $1.12B
Revenue Surprise Beat by $18.63M
My View
NIQ offers exposure to a global consumer-data business with recurring subscription revenue, strong customer retention, and growing AI capabilities. Improving margins and cash generation are encouraging, but GAAP losses, substantial debt, and share-price volatility remain significant risks. The key question is whether NIQ can sustain organic growth and turn its improving adjusted profitability into durable cash generation.
Active Positions