

USA stock market powers higher – Quant stock Portfolios up seven weeks straight – Update 05/11/26
Is sell in May and go away a viable investment strategy?

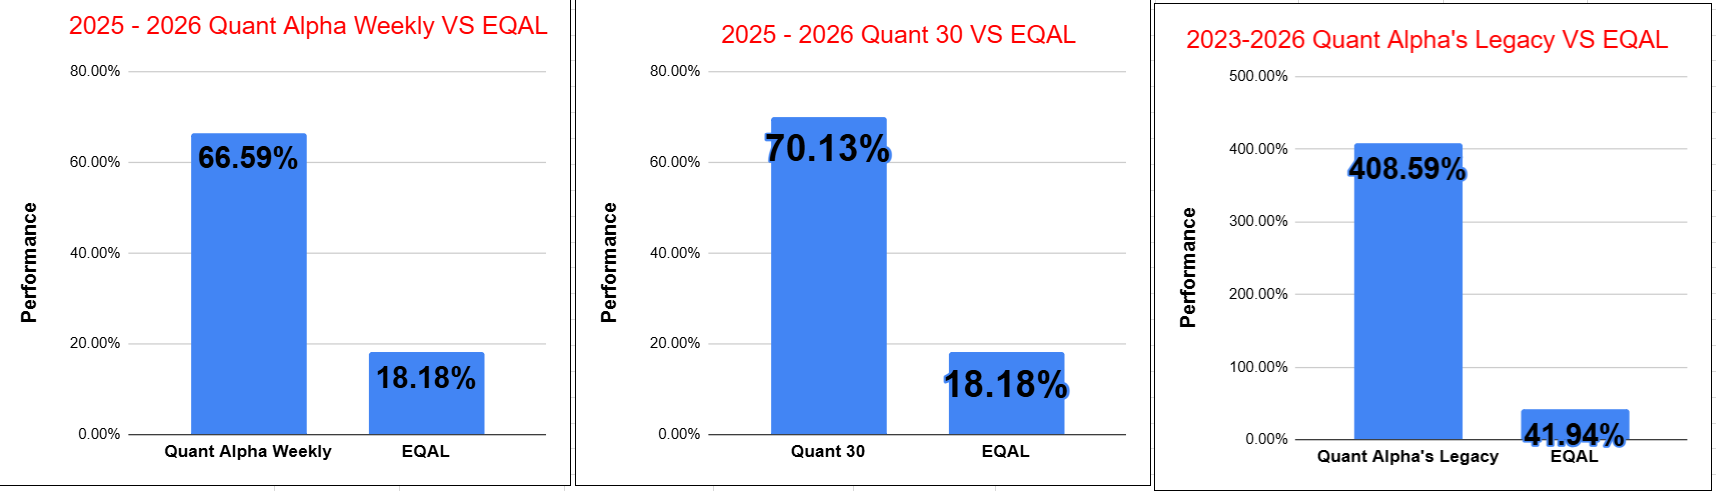
Quant Weekly – Up over 66% since June 2025
Quant 30 – Up over 70% since June 2025
Legacy – Up over 400% since April 2023
Sterling Infrastructure (STRL) became a 13 bagger in the Legacy Portfolio this week
Education – Is sell in May and go away a viable investment strategy?
USA Stock market week ending 05/08/26
Major Index Performance (Weekly)
SPY (S&P 500 ETF) +2.4%
Large-cap U.S. stocks posted a strong weekly advance as investor sentiment improved and broader market participation expanded.
^IXIC (Nasdaq Composite) +4.5%
Technology and growth stocks led the market sharply higher, giving the Nasdaq the strongest performance among the major indexes.
DIA (Dow Jones Industrial Average ETF) +0.2%
Blue-chip industrial and defensive names lagged the broader market, producing only modest gains for the week.
IWM (Russell 2000 ETF) +1.8%
Small-cap stocks moved higher as risk appetite improved, though performance still trailed the technology-heavy Nasdaq.
Takeaways
Technology and growth stocks clearly dominated market performance during the week.
The Nasdaq significantly outperformed the Dow, highlighting continued investor preference for higher-growth sectors.Broader market participation improved, with both large-cap and small-cap indexes finishing the week higher.
Market Drivers this Week (05/11/26 – 05/15/26)
Monday
U.S.-China trade talks could move tech, retail, and industrial stocks hard depending on tariff headlines.
New Fed Chair Kevin Warsh starts his first full week, and traders are watching for any shift in Fed tone.
Tuesday
CPI inflation data drops and could completely change rate-cut expectations.
Walmart earnings give a major read on consumer spending strength and retail demand.
Wednesday
PPI inflation data could fuel more stagflation worries if wholesale prices stay hot.
Cisco earnings are a key test for AI infrastructure and enterprise tech spending.
Thursday
Retail sales numbers show whether the American consumer is still spending aggressively.
Applied Materials earnings could swing the semiconductor and AI chip trade.
Friday
Consumer sentiment and inflation expectations could move both stocks and bonds heading into the weekend.
Options expiration and U.S.-China trade deal details could add extra volatility late in the week.
The CNN Fear and Greed Index ends the week at Greed 67. This is the fourth week in row at the Greed setting. This follows nine straight weeks at the Fear or Extreme Fear setting. Risk-on is certainly in the drivers seat and the market reflects this.
The Quant 30, Quant Weekly and Quant Legacy Model Portfolios all made all time highs this week. Quant Weekly and Quant 30 have been higher for seven weeks in a row. Risk On is fully in control and we continue to ride the wave up.

Note: You are enjoying the free subscriber newsletter. Paid subscribers enjoy instant access to weekly Model Portfolio updates upon release and a Top Quant Stocks list. Free subscribers get access to Portfolio updates after a three-week delay but no Top Quant Stocks list. Want timely access to the new Adds/Removes and Top Quant Stocks list?
Model Portfolio Quant Alpha Weekly
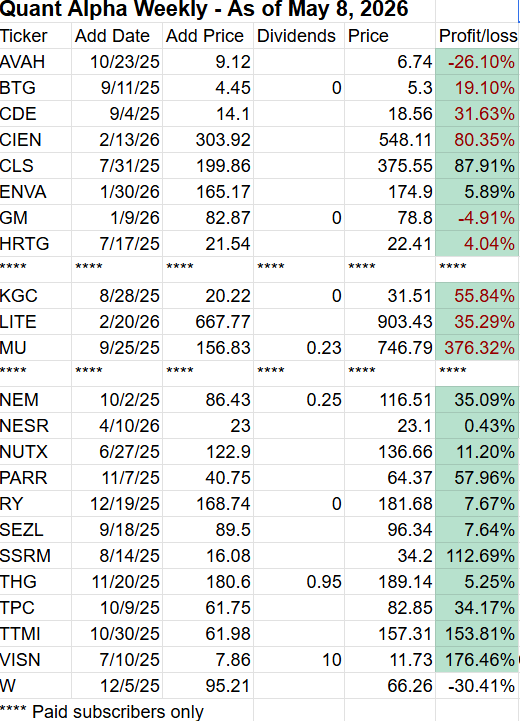
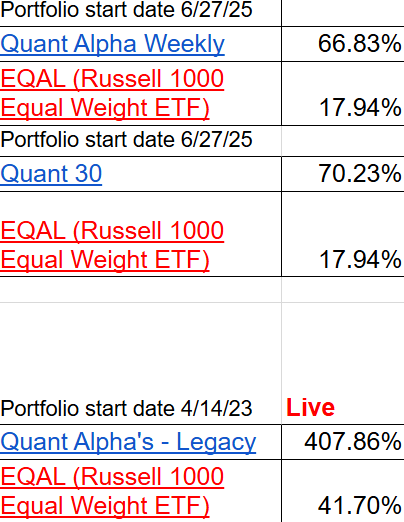
Any newly added stock is being released to Paid Subscribers today. Below are the updates from three weeks ago. This Portfolio continues to significantly outperform its benchmark, 66% versus 18%. It has 25 members.
Top five Quant stocks in the Portfolio (Paid subscribers only).
No changes to the Portfolio this week
Add (04/17/26) : None
Remove (04/17/26) : None
Outperformers: SSRM (SSR Mining) up over 110%, MU (Micron Technology) up over 370%, VISN (Vistance Networks) up over +170%
Model Portfolio Quant 30
This week’s new update, if any, is being released to the paid subscribers. Shown below is the update made three weeks ago. This Portfolio continues to beat its benchmark by a wide margin, 70% to 18%. It has 30 members in it.
Top five Quant stocks in the Portfolio (Paid subscribers only).
No changes to the Portfolio this week
Add (04/17/26): None
Remove (04/17/26): None
Outperformers: MU (Micron Technology) up over 510%, GFI (Gold Fields) up over 80%, LITE (Lumentum Holdings) up over 270% and TTMI (TTM Technologies) up over 120%
Model Portfolio Quant Alpha’s – Legacy
The portfolio is up over +400% since it began in 2023. It has 18 stocks in it. Powell industries is now a 16 bagger. Celestica is now a 15 bagger and now Sterling Infrastructure has become a 13 bagger.
Sterling Infrastructure had blow out earnings this past week. It started the week at $532 and ended the week at $844. It is now a 13 bagger.
Top five Quant stocks in the Portfolio (Paid subscribers only).
Remove (04/17/26): None
Outperformers: AGX (Argan) up over 800%, STRL (Sterling Infrastructure) up over 1300%, POWL (Powell Industries) up over 1600% and CLS (Celestica) is up over 1500%

Performance to 05-08-2026
Top Quant Stocks for this week – (Paid subscribers only feature)

Is sell in May and go away a viable investment strategy?
WHERE THE PHRASE COMES FROM
Old-school Wall Street saying — not some modern quant model
Came from London traders who literally left for summer vacation
Idea: Stocks underperform May → October vs November → April
WHAT THE DATA ACTUALLY SHOWS (HISTORICALLY)
Winter months have been stronger — no argument there
Nov–Apr avg return ~6–8% vs ~2–3% May–Oct
Markets are still positive in the summer — just weaker on average
May–Oct positive ~2/3 of the time
Long-term studies confirm the “gap” exists
Returns ~4% higher in winter vs summer periods
In other words – Yeah, there’s a seasonal pattern — but it’s not a crash season, just a slower one
BUT HERE’S THE PROBLEM — IT DOESN’T HOLD UP CONSISTENTLY
Staying invested actually wins long-term
Buy & hold CAGR ~8.05% vs ~6.86% using Sell-in-May strategy
You miss compounding by sitting out
Small differences each year → massive gap over decades
Recent decades? Way less reliable
Markets have gone up in most May–Oct periods (25 of last 33 years)
Some studies say it only worked ~14 out of 38 years
That’s basically a coin flip
It worked “kind of” in the past… but not enough to bet your portfolio on it
MODERN MARKET REALITY (THIS IS WHY IT’S FADING)
Markets don’t shut down anymore
Algorithms, global trading, 24/7 flows
AI, macro, geopolitics > seasonality now
Big drivers matter more than the calendar
Summer can still rip
Plenty of strong rallies happen May–August
The calendar isn’t moving markets — money flows are
WHEN IT CAN STILL HAVE VALUE
Short-term traders use it as a bias, not a rule
Helps frame expectations for weaker seasonality
Late summer (Aug–Oct) tends to be the weakest stretch
That’s where most volatility historically shows up
Works better in certain cycles (like election years)
Not consistent, but sometimes shows up
BOTTOM LINE
“Sell in May” isn’t a strategy — it’s a tendency
Yes, returns are weaker in summer… but still positive most of the time
If you follow it blindly, you’re probably leaving money on the table
Smart investors don’t sell because of the calendar —
they sell because the setup changes

“SELL IN MAY” — WHEN IT ACTUALLY WORKS (AND WHEN IT BLOWS UP)
WHEN IT WORKS (EDGE CASES)
Late-cycle or overextended markets
When valuations are stretched and momentum is fading
Think: market already ran hard → summer = digestion or pullback
Rising interest rates / tightening liquidity
When the Fed is tightening, summer weakness shows up more
Liquidity dries up → fewer buyers → softer markets
Pre-recession or macro uncertainty
When economic data starts rolling over
Summer becomes risk-off before the real damage hits
Weak leadership / narrow market breadth
If only a few stocks are carrying the market, it’s fragile
Summer rotations can hit those leaders hard
Post big Q1 rallies
If Jan–April was strong, May–Sept often cools off
Markets need to reset before next leg
August–October window (THIS is the real danger zone)
Most historical volatility lives here — not May/June
That’s where corrections usually show up
WHEN IT FAILS (AND COSTS YOU MONEY)
Early bull markets / fresh breakouts
When a new uptrend just started — you do NOT want to leave
That’s when big upside happens
Strong earnings + strong macro combo
If companies are beating and economy is stable → market grinds higher
No reason for seasonal weakness to kick in
AI / structural themes driving flows
When there’s a dominant narrative (like AI)
Money doesn’t care about the calendar — it chases growth
Heavy institutional inflows
If big money is rotating in, seasonality gets ignored
Flows > historical averages
Election years / stimulus cycles
Markets often stay supported longer than expected
Low volatility environments
If VIX is low and stable → dips get bought quickly
BOTTOM LINE
“Sell in May” isn’t wrong — it’s just incomplete
The real edge is knowing when the environment matches the pattern
If you treat it like a rule, you lose

Quick Links
See comments below for the links.
All content on this site is for informational purposes only and does not constitute financial advice. Consult relevant financial professionals in your country of residence to get personalized advice before you make any trading or investing decisions. This post was written with the assistance of artificial intelligence. The original ideas and final review are human-generated.
For a look at the live scorecard for Position Trader, see the google doc link below.
It has the Live performance numbers and some links back to more information about the three Quant stock Model Portfolio's.
https://live-scorecard.position-trader.com/
Blog Post overview
https://docs.google.com/document/d/1P2W1994O6SXvb4qfx2fqCFXnJSbPH3KJWQvqrGNqmCw/edit?tab=t.0
Investment Education Posts
https://positiontrader.blog/investment-education-blog-posts/
Seven consecutive weekly gains in quant portfolios and a CNN Fear and Greed Index at 67 are momentum signals worth cross-referencing against positioning data.
America sits at #2 in the regional TAA Consensus Table, with 51.7% of managers overweight and an upward trend, so the quant momentum is running with the consensus, not against it. The more analytically useful point in this article is actually buried in the "sell in May" education section: the pattern holds most reliably in late-cycle environments with stretched valuations, rising rates, and narrow breadth.
All three conditions are present right now. Federated Hermes, Asset Allocation Award winner 2026, flags this late-cycle read directly: "A combination of rising inflation (partly driven by high commodity prices), accelerating growth and rich valuations makes us think that we may be approaching the late-cycle phase in the equity market cycle."
The invalidation risk is a strong CPI print this week that reprices the cut narrative and removes the Goldilocks assumption underpinning the seven-week run.
Does your quant model incorporate macro regime filters, or does it operate purely on price and momentum signals?